
Your bandwidth usage is the sum total of all traffic from and to your account on the server, including visitors accessing your site, FTP uploads and incoming/outgoing emails.
The server will automatically send bandwidth warnings at 70%, 80%, 90%, 95%, 97%, 98%, 99% and 100% usage to the contact email specified in cPanel under "Preferences -> Update Contact Details".
The bandwidth is reset on the 1st of every month at 00:00.
Checking Bandwidth Usage
- Log into cPanel.
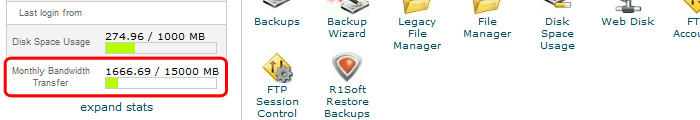
- On the left hand side, you can see a summary of your current usage
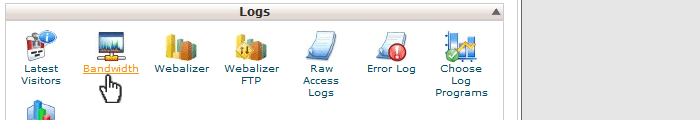
- For details, please go to "Logs-> Bandwidth"
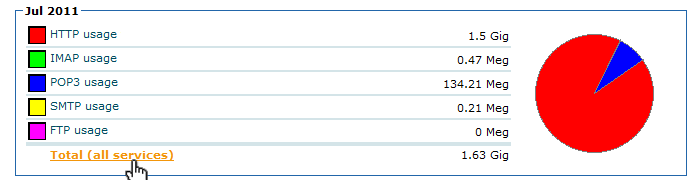
- Scroll down the page where you can see the summary stats for each month. For details, click "Total (all services)" under the relevant month.
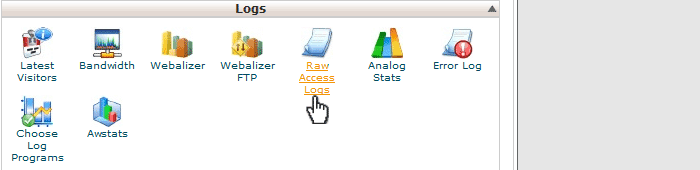
Checking Awstats
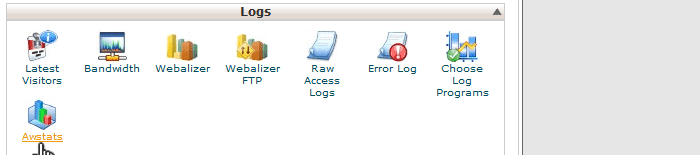
- In your site's cPanel go to the Awstats link and click on it.
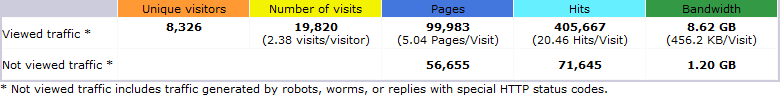
- At the top of Awstats you can review the "Viewed" vs "Not Viewed" traffic. Not Viewed traffic includes all robots and if unusually high, may indicate a problem with excessive spidering.
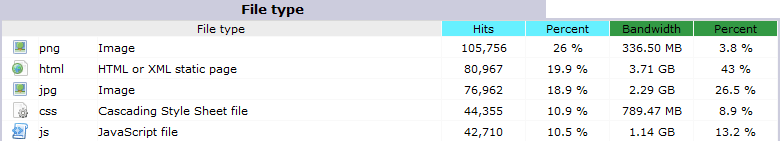
- Further down, you can also review the type of files being accessed. Which file types dominate will depend on your site's coding but any unexpected or unusually high results may indicate an area for optimisation.
Common Problems
SPIDERS
Search engines, price comparison sites and other companies index the internet with the use of automated spiders. Most reputable companies will do this spread out over a period of time, but some spiders can be aggressive and move through your site at high speed. This can quickly rack up bandwidth.
To check whether a spider is responsible for unexplained bandwidth usage, please first check the stats as explained above. Then if the unexplained traffic is HTTP, you can use Awstats to further drill down into how the bandwidth is being used. Awstats is accessible from cPanel under "Logs -> Awstats".
EMAIL AND ATTACHMENTS
Incoming and outgoing email is part of the bandwidth. For users with large attachments or frequent email usage, this can lead to high bandwidth even if the website itself receives little traffic. Email usages will show in the stats as "POP3" for incoming, "SMTP" for outgoing and "IMAP" for IMAP services.
IMAP
Every time the server is accessed with a new device for IMAP, the entire mailbox is being synced. For users with large mailboxes, this can lead to high bandwidth usage and will show up in the stats under "IMAP".
Analysing the Raw Access Log
The raw access log will show you exactly who accesses your site where, but due to the number of entries it can be tricky to distinguish patterns or major bandwidth users.
The easiest method to analyse the log is via MS Excel or a similar spreadsheet program. To use Excel to analyse the log:
- From within cPanel download the raw access log, save to your PC/Mac and unzip.
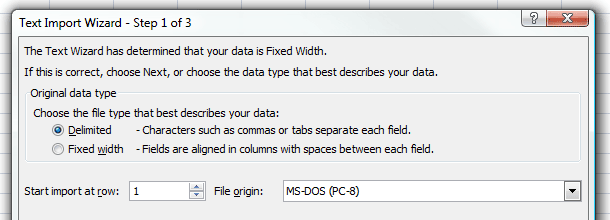
- Open Excel and from within Excel open the log file. This should bring up the import options. Choose "delimited".
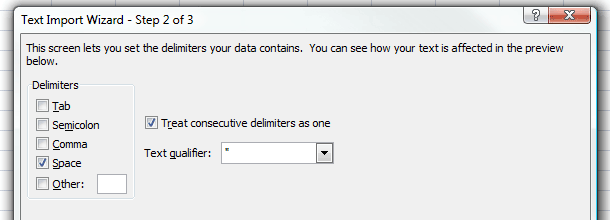
- On the next screen choose "Delimiters: Space". Click "Finish".
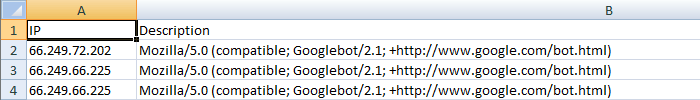
- On the Excel page, delete all columns except the first (IP number) and the last (description). Insert a new row right at the top, and enter a name for each column (eg IP, Description).
- Highlight the entire sheet, click "Insert -> Pivot Table". Under Values, enter IP count, under Row Labels enter IP.
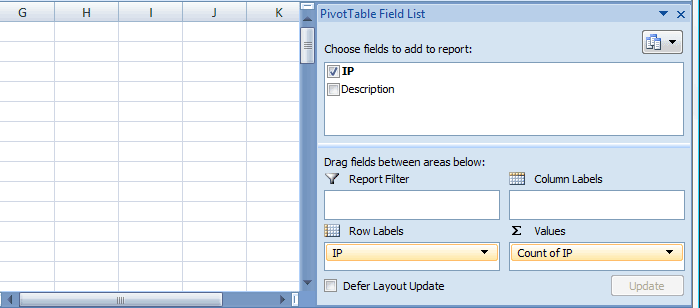
- This should now give you a quick overview of the key IPs accessing your site - the higher the count, the more often this IP accessed your site. You can then look back at the raw access log to see details for this IP and find out its name (eg google bot etc).

TWENGA BOT
The twenga bot from twenga.com has caused considerable bandwidth usage on some sites on our servers. It indexes sites aggressively, sometimes with multiple simulatenous connections/IPs and at a fast rate. This can lead to high bandwidth usage with little benefit to the site owner.

For a list of current IPs used by twenga, see eg http://user-agent-string.info/list-of-ua/bot-detail?bot=TwengaBot.
Blocking Twenga in robots.txt via the usual deny rule is an option, but various sites have reported that twenga does not obey robots.txt so this may not stop the problem.
For a complete block, either block the IP (see below) or block the bot via .htaccess user agent rule. In your root .htaccess file add:
|
1
2
3
4
|
# let's block twengaRewriteEngine onRewriteCond %{HTTP_USER_AGENT} ^twengaRewriteRule ^.*$ - [F] |
Related article: https://clients.fluccs.com.au/knowledgebase/829/Banning-bad-bots.html
BLOCKING IPS
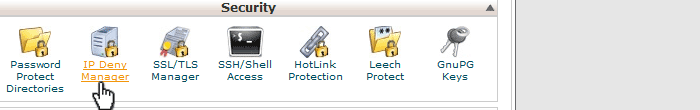
IPs can be blocked from a website via the IP Deny Manager in cPanel. Once you have identified an IP that is causing you problems, enter it into the IP Deny Manager and this IP will be blocked from accessing your site.
Bear in mind that bots can operate from an IP range, so you may need to keep an eye on your access logs and block troublesome IPs as they appear.
